Regression – Find relation between Multiple Inputs and Target variable
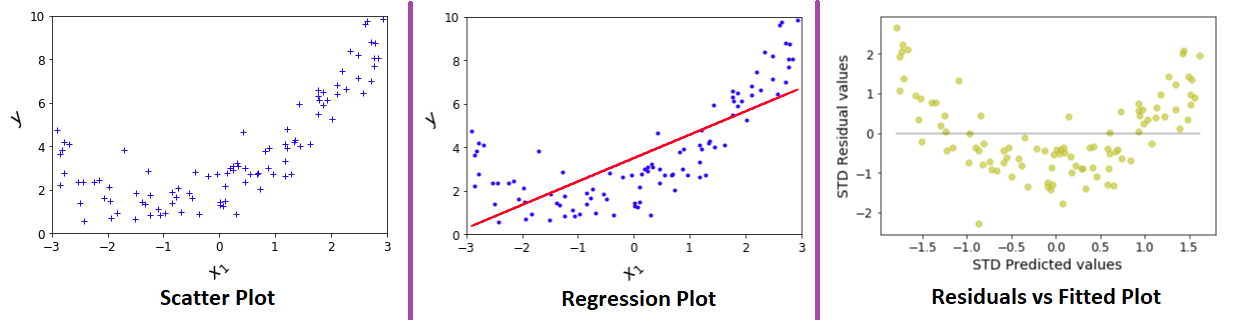
One Input variable : When only one input variable and one output variable, scatter chart is useful in finding relationship X1 and y. Below diagram shows the example of such dataset.
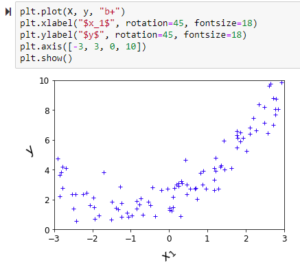
Multiple Input variables : Quite often we see regression datasets with multiple input variables. With n-input and one output variable, an n+1 dimensional graph needs to be plotted. It is difficult to draw a plot with more than three dimensions. Linear Regression algorithm will provide a way to visualise this multi-dimensional graph in two dimensions.
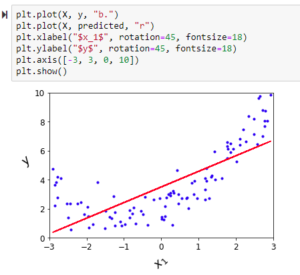
A graph between residuals ( target value – predicted value ) vs fitted value ( predicted value ) would explain the relation between multiple input and output variable. The steps are as below.
- Fit a Linear Regression model.
- Predict values for all records.
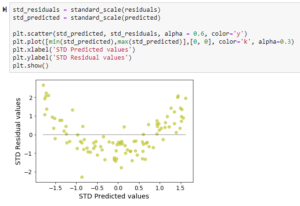
- Calculate residuals ( target value – predicted value ).
- Fit a graph between residuals and predicted values.
How it works ?, the logic is simple, when we fit a straight line through data, relation between ERRORS (target minus predicted value) and PREDICTIONS resembles the relation between INPUT and OUTPUT variables.
let’s try to understand the concept with one input variable first.
When we observe above plot, predictions are made on “fitted line”, below two statements hold true
- (a) The “data points” far from “fitted line” (or predicted value) will have huge error (positive or negative).
- (b) The “data points” close to “fitted line” (or predicted value) line will have less error (positive or negative).
Now let’s look at Residuals vs Fitted Value graph.
This graph resembles the relationship between input variable and output variable. This is happening because of (a) and (b) mentioned above.
This holds true even when the data set contains n – number of input variables. Once after fitting a straight line through data, we get one Residual column and one Predicted column (irrespective of number of input variables). We have standardized the data and plotted the graph to make the pattern clearly evident.
By
– Venkata Rama Raju
as I website owner I believe the content material here is very excellent, regards for your efforts.