
Finding Outliers in Machine Learning
Did you ever notice? Anything that stands away from the “common” will always demand attention. Such un-common observation is usually called as outlier.
As an example, everybody performs very well in your project team, but there are two buddies performs way different then everybody else in the team, you may call these two buddies as outliers.
You may know how to handle those “un-common” (outlier) observations in your personal life, and being an analytics professional you must know how to detect and handle the outliers in the data. As part of uni variate analysis You can find outliers values (i.e. an un-common value like extremely large or extremely low) in a feature / variable. As part of multi-variate analysis you can find outlier data points in the entire data-set. Let me discuss finding and treating outliers in these two scenarios.
Outliers can be part of the data due to genuine reasons at data generation process – this scenario must be taken seriously, in this case the outliers are valid and your project requirement should decide how to treat these values. The RCA (Root Cause Analysis) here will give a new direction to the analysis process. On the other hand, as part of RCA you may find that sometimes outliers might have been generated due to human data entry errors or measurement mistakes – we may treat this case as missing data and act accordingly.
The presence of Outliers would affect the outcome of your analysis if they are ignored, not identified, and not treated. A simple example is, Mean and mean based calculations like Standard Deviation, several cost functions like Mean Squared Error-MSE will be affected by (sensitive to) outlier values and that ends with misleading outcomes if ignored. Hence, during data analysis, it is very important to detect and treat the outliers.
As you know when you perform uni-variate analysis you pay attention on every individual feature at time. In this context, you can follow these methods (IQR based calculation, Z Score values based, Histogram and Box Whiskers plot visuals) to identify the outliers.
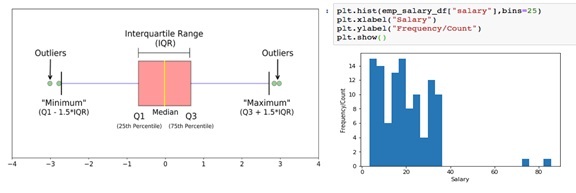
1).IQR (Inter Quartile Range)is a measure of dispersion with in Q1 (25th Percentile) and Q3 (75th percentile) IQR = Q3-Q1. It is well visible in Box-Whisker plot. IQR is the length of the Box in Box-Whisker plot.An outlier is any value that falls away more than one and a half times the length of the box from either end of the box.That is, if the value is below Q1 – 1.5×IQR or above Q3 + 1.5×IQR is treated as outlier. As you see here, Outliers are clearly visible in Histogram and Box-plot.
2).If you assume the feature follows normal distribution, then if you transform (i.e replacing each value with corresponding z-score value) such feature to “standard normal distribution” which ever the values fall beyond 2 or 3 standard deviations can be treated as outliers.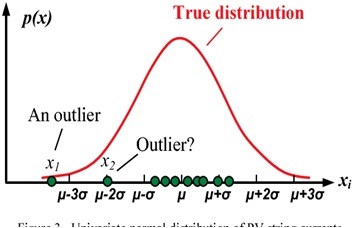
When you perform Multivariate analysis, here are the ways that will help you to identify outliers.Isolation Forests, Unsupervised learning techniques like DBSCAN clustering would help us to figure out outlier data points.
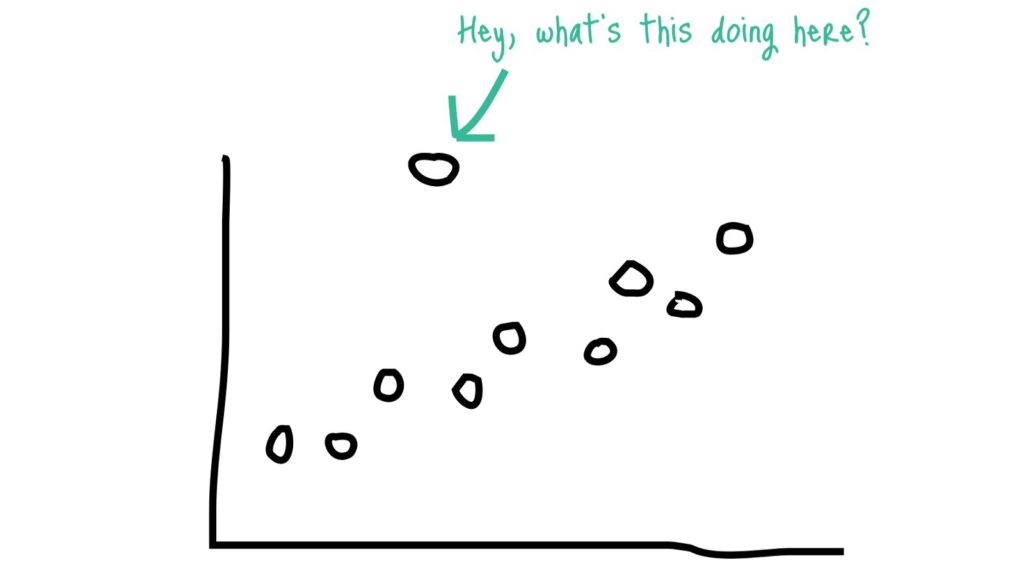
3).As part of Bi-variate analysis, when you look at scatter plot you may observe some points that fall far away from rest of the data points. You may attention on those points so that you gain more details to know whether to consider them as outliers.
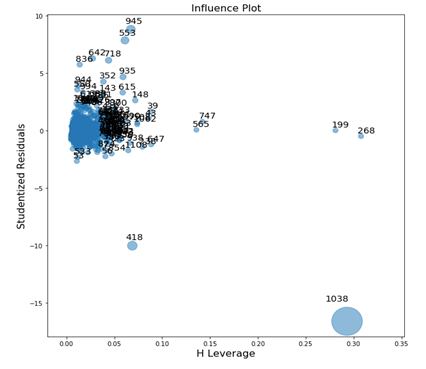
4). As part of Multivariate analysis during regression, some times as a special case I consider influence data points as outliers. An observation is said to be influential if removing the observation substantially changes the estimate of coefficients. Here is a code example that finds influential data point in the data set.
[codesyntax lang=”python”]
import statsmodels.api as sm
from statsmodels.graphics.regressionplots import *

import matplotlib.pyplot as plt
import seaborn as sns
%matplotlib inline

fig, ax = plt.subplots(figsize=(24,24))
#criterion : ‘Cooks’ – this is criterion to base the size of the points on (bubble size) the plot
fig = sm.graphics.influence_plot(best_multi_reg_model, ax = ax, criterion="cooks", plot_alpha=0.5)
plt.show()
[/codesyntax]
The above discussion would help you with few tools to identify outliers as part of EDA or statistical modeling. More than this, outlier detection based applications can be called as Anomaly Detection solutions, few examples are Fraud detection, Detecting Erroneous treatments in health care, Intrusion detection in networks, Defect detection in manufacture etc. Hope you understood the discussion on “being unusual” and received key take outs.
By Praveen Vasari
Big Data & Data Science Architect
DataJango Technologies Pvt Ltd.
Deference to op, some excellent information .
Loving the info on this site, you have done outstanding job on the content.